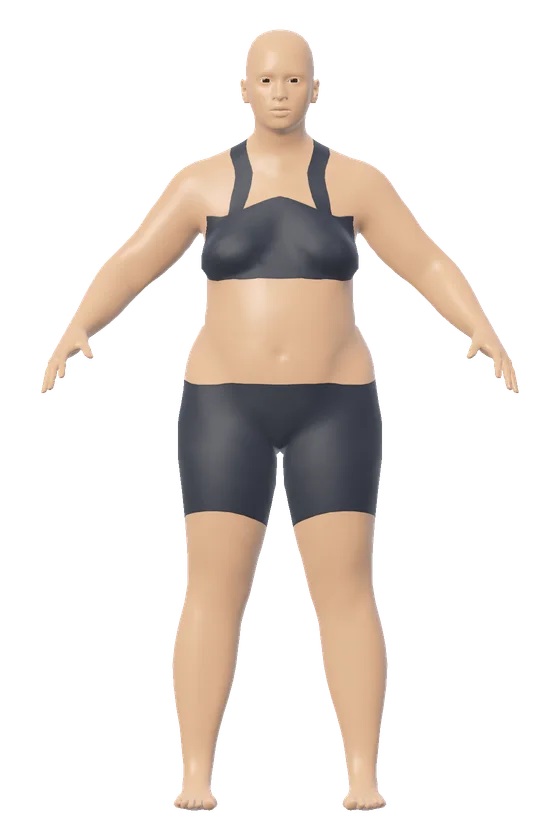
The female figure opens at 161.2 cm (5 ft 3.5 in) and 77.9 kg (171.8 lb). Those are the mean height and weight of US women aged 20 and older, as the CDC measured them from August 2021 to August 2023. From there every number is yours to change: height, weight, bust, under bust, waist, hips and nine more tape measurements. Enter a weight other than your own and the tool acts as a female body simulator, with the height held and the figure redrawn.
The average US woman on screen, then 104, 88 and 110 cm typed in
With no tape measurement typed, the model estimates a bust of 100.7 cm, an under bust of 91.2 cm, a waist of 97.3 cm and hips of 112.9 cm for this body. The BMI works out at 29.98. The tool shows it as 30 and labels it obesity class 1, the CDC category that starts at 30. Waist to hip reads 0.86, which meets the 0.85 cut-off for women. Waist to height reads 0.60, high central adiposity in the NICE bands. The shape line says triangle: the hips are 12.2 cm (4.8 in) larger than the bust and 15.6 cm (6.1 in) larger than the waist.
Now take a woman of the same height and weight with other tape numbers: a 104 cm bust, an 88 cm waist and 110 cm hips. In inches that is 40.9, 34.6 and 43.3. Type the three in. All three are reached, and the figure still weighs 77.9 kg. The under bust settles at 93.2 cm and the thigh grows from 57.7 to 60.4 cm. With the weight fixed, what comes off the waist is added elsewhere.
Both ratios drop: waist to hip to 0.80 and waist to height to 0.55, the increased band. The shape class becomes rectangle. Bust and hips are now 6 cm (2.4 in) apart, inside the 3.6 in the rules allow. The waist is 16 cm (6.3 in) smaller than the bust, short of the 9 in an hourglass needs. The BMI stays at 30, since height and weight have not changed. "Start over" brings back 161.2 cm and 77.9 kg.
How the female figure gets its size
Height sets the scale: the whole figure is stretched or shrunk to the height entered. Weight sets the volume. The model works out a body density from the BMI, which is 1.015 kg per liter for this body. It then fills the figure to the volume that weighs 77.9 kg at that density: 76.7 liters.
Tape numbers are taken from the figure as a tape would take them. Bust is a level cut at the fullest point of the chest, with the arms left out. For under bust, the tool asks for the ribcage directly under the bust. A number you type is held, and the rows you leave alone remain the model's estimate. The density formulas and each fitting step are set out with the 3D body visualizer.
Bust, under bust and seven shapes: what the female figure adds
Two rows belong to the female figure only: bust and under bust. Type 86 cm into under bust on the opening body and the bust follows it down from 100.7 to 95.7 cm. The waist stays close, at 96.9 cm, and the hips move out to 114.2 cm.
The shape picker holds a typical figure and seven female shapes. Choosing one keeps the height and weight and sets bust, waist and hips to numbers inside that shape.
| Shape picked | Bust | Waist | Hips | Class by the published rules |
|---|---|---|---|---|
| Hourglass | 111.7 cm (44.0 in) | 85.1 cm (33.5 in) | 113.0 cm (44.5 in) | Hourglass |
| Top hourglass | 114.3 cm (45.0 in) | 87.7 cm (34.5 in) | 106.7 cm (42.0 in) | Top hourglass |
| Pear | 100.6 cm (39.6 in) | 96.8 cm (38.1 in) | 113.3 cm (44.6 in) | Triangle |
| Rectangle | 107.8 cm (42.4 in) | 95.1 cm (37.4 in) | 110.3 cm (43.4 in) | Rectangle |
| Inverted triangle | 113.2 cm (44.5 in) | 92.8 cm (36.5 in) | 100.5 cm (39.6 in) | Inverted triangle |
| Apple | 110.6 cm (43.5 in) | 108.1 cm (42.5 in) | 104.3 cm (41.0 in) | Oval |
| Diamond | 103.6 cm (40.8 in) | 111.2 cm (43.8 in) | 106.1 cm (41.8 in) | Diamond |
The class names come from a formula set written for clothing research. Lee, Istook, Nam and Park turned seven shape descriptions into formulas in a 2007 study of US and Korean women. Sokolowski and Bettencourt printed those formulas in 2020 and added oval and diamond for a waist larger than the hips. The rules compare bust, waist, high hip and hips in inches. They sort bodies for garment fit and carry no health meaning. The picker's pear and apple are everyday names for the triangle and oval classes.
The body shape visualizer stands all seven side by side at any height and weight. The body shape calculator checks every rule against your own four measurements.
US women from the 5th to the 95th percentile
The opening body is a mean, and a mean hides the spread around it. In the same CDC survey, 3,307 women aged 20 and older were measured for height and 3,254 for weight. A percentile is the share of women at or under a value: 25 in 100 weighed 62.6 kg or less.
| Percentile | Height | Weight | BMI | Waist |
|---|---|---|---|---|
| 5th | 149.6 cm (58.9 in) | 50.7 kg (111.8 lb) | 19.7 | 73.8 cm (29.1 in) |
| 10th | 152.0 cm (59.8 in) | 54.7 kg (120.6 lb) | 21.5 | 77.0 cm (30.3 in) |
| 25th | 156.4 cm (61.6 in) | 62.6 kg (138.0 lb) | 24.1 | 84.9 cm (33.4 in) |
| 50th (median) | 161.2 cm (63.5 in) | 73.5 kg (162.0 lb) | 28.3 | 95.7 cm (37.7 in) |
| 75th | 166.1 cm (65.4 in) | 89.2 kg (196.7 lb) | 34.4 | 109.2 cm (43.0 in) |
| 90th | 170.4 cm (67.1 in) | 107.2 kg (236.3 lb) | 40.9 | 121.5 cm (47.8 in) |
| 95th | 172.5 cm (67.9 in) | 119.2 kg (262.7 lb) | 44.9 | 129.2 cm (50.9 in) |
| Mean | 161.2 cm (63.5 in) | 77.9 kg (171.8 lb) | 30.0 | 97.9 cm (38.5 in) |
Height is even on both sides: the mean and the median are both 161.2 cm. Weight is not. The 95th percentile is 45.7 kg over the median, and the 5th is 22.8 kg under it. That pulls the mean of 77.9 kg to 4.4 kg more than the median of 73.5 kg. Type 73.5 into the weight box to see the median weight at the mean height. The BMI reads 28.3, overweight, and the model draws a 92.0 cm waist and 109.7 cm hips.
The waist column is not a dress size. It was taped at the top of the hip bone and printed in centimeters. The inch figures are conversions at 2.54 cm per inch. Hip, chest and limb figures are in the guide to average body measurements of US men and women.
What a figure at the average can and cannot show
Many different bodies share the mean's two numbers, and the model drew one of them from height and weight alone. It gives hips of 112.9 cm, where the CDC's measured mean for women is 109.8 cm. It gives a waist of 97.3 cm at the natural waist, where the CDC's mean at the hip bone is 97.9 cm. Your own tape at 161.2 cm and 77.9 kg may read differently again, which is why every row can be set.
A plain fitted base layer covers the figure, which has a general human form and no surface detail. No camera or scanner is involved, and the figure does not forecast how any one woman would look at another weight.
Each readout beside the figure follows a published source. The CDC states that BMI does not directly measure body fat and does not distinguish between fat, muscle and bone mass. The World Health Organization's report on waist measures lists a waist to hip ratio of 0.85 or more for women as a substantially increased risk of metabolic complications. NICE in England counts a waist to height ratio of 0.6 or more as high central adiposity, in adults with a BMI under 35. While the waist and hip rows say "estimated", both ratios are the model's estimates too. Your own health is a question for a doctor or nurse, who can assess you in person.
Turning, zooming and comparing two female figures
The figure turns left, right, up or down under a mouse drag or a finger swipe, and from the keyboard with the arrow keys. To zoom, pinch, scroll with Ctrl held, or press plus and minus. A two-finger drag, or a drag with Shift held, slides the view across. Front, Side and Back each jump to that view, and a double tap or the home button goes back to the front.
"Compare two" puts a body B beside body A, or lays B over A as a light outline. Try your own numbers as A and 161.2 cm with 77.9 kg as B. "Weight range" lines up five figures at one height, with the weight entered in the middle. On the opening body with a 5 kg step, the row runs from 67.9 kg to 87.9 kg, and each figure carries its weight and BMI.
"Tape lines" draws the bust, waist and hip tapes on the figure with their values. For units, choose centimeters and kilograms, feet, inches and pounds, or stone and pounds, and the values carry over. The switch at the top of the panel changes to the male figure. To begin from a man's average height and weight, use the male body visualizer. The copy button makes a link with the numbers stored inside it, and nothing you type is sent to a server.