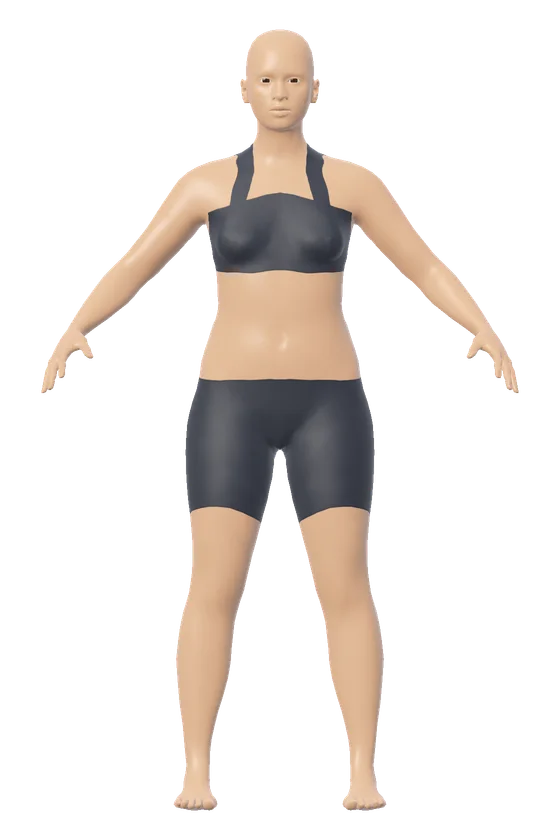
The World Health Organization draws its line at a waist to hip ratio of 0.85 for women and 0.90 for men. At or over that line, its table lists a substantially increased risk of metabolic complications. The ratio is a single division: waist circumference over hip circumference, in any unit, as long as both use the same one.
Waist and hip numbers stay in the browser, where the division is done.
Two worked examples: 0.75 and 0.95
A woman has a 74 cm waist and 99 cm hips. Then 74 ÷ 99 = 0.75, which is under the women's cut-off of 0.85. With 99 cm hips, her ratio would reach 0.85 at a waist of 84.1 cm.
A man has a 38 in waist and 40 in hips. Then 38 ÷ 40 = 0.95, which is over the men's cut-off of 0.90. With 40 in hips, his ratio reaches 0.90 at a waist of 36 in.
The unit makes no difference to the ratio. The woman's 74 cm and 99 cm are 29.1 in and 39 in, and 29.1 ÷ 39 is 0.75 again.
The formula and the boundary rule
Waist to hip ratio = waist ÷ hips.
The waist size at which a ratio reaches the cut-off is the hip size times 0.85 for women, or times 0.90 for men. The calculator gives that waist with each result.
The WHO table marks both cut-offs as greater than or equal to. A woman at exactly 0.85 and a man at exactly 0.90 count as at the cut-off, and the calculator does the same. Not every source reads the boundary that way. An earlier WHO report, from 1999, defined abdominal obesity as a ratio over 0.90 for males and over 0.85 for females.
WHO gives one line for each sex and nothing more. It prints no low, moderate and high bands and no lower limit.
The WHO protocol for measuring waist and hips
- Stand with feet close together, arms at the sides and weight even on both feet, wearing little clothing.
- Find the lower edge of the last rib you can feel and the top of the hip bone (the iliac crest). The waist tape goes midway between them.
- Put the hip tape around the widest part of the buttocks.
- Keep the tape parallel to the floor, snug against the body and not pulled tight. The WHO protocol calls for a stretch-resistant tape that holds a constant 100 g of tension.
- Relax, breathe normally and read the tape at the end of a normal breath out.
- Take each measurement twice. If the two readings are within 1 cm, use their average. If they differ by more, measure both again.
The calculator's waist field uses this WHO site. Other protocols put the waist tape elsewhere. The US National Institutes of Health and the NHANES III survey measure at the top of the hip bone. One US study protocol used the level of the navel, and the WHO report notes that navel readings may underestimate the true waist. A ratio taken at one site should be compared only with ratios taken at the same site.
Where the WHO numbers came from
| Measure | Men | Women | Risk of metabolic complications | Origin given in the 2011 report |
|---|---|---|---|---|
| Waist to hip ratio | 0.90 or more | 0.85 or more | Substantially increased | The definition of metabolic syndrome in a 1999 WHO report on diabetes |
| Waist circumference | Over 94 cm | Over 80 cm | Increased | A table in a 2000 WHO obesity report, drawn from a Dutch sample |
| Waist circumference | Over 102 cm | Over 88 cm | Substantially increased | The same table from the Dutch sample |
All three cut-offs come from one table in the report of a WHO expert consultation, held in Geneva in December 2008 and published in 2011. The report introduces that table as the recommendations "often attributed to WHO". It traces the ratio cut-offs to the 1999 report. It traces the waist figures to a random sample of 2,183 men and 2,698 women aged 20 to 59 in the Netherlands. Those figures, it says, were an example only and not WHO recommendations.
The 2008 consultation set no new numbers. It concluded that the evidence could not yet settle whether cut-offs should be specific to sex, age and population, and it asked for further studies.
The waist size at each cut-off, by hip size
| Hips | Waist at 0.85, the women's cut-off | Waist at 0.90, the men's cut-off |
|---|---|---|
| 34 in (86.4 cm) | 28.9 in (73.4 cm) | 30.6 in (77.7 cm) |
| 36 in (91.4 cm) | 30.6 in (77.7 cm) | 32.4 in (82.3 cm) |
| 38 in (96.5 cm) | 32.3 in (82 cm) | 34.2 in (86.9 cm) |
| 40 in (101.6 cm) | 34 in (86.4 cm) | 36 in (91.4 cm) |
| 42 in (106.7 cm) | 35.7 in (90.7 cm) | 37.8 in (96 cm) |
| 44 in (111.8 cm) | 37.4 in (95 cm) | 39.6 in (100.6 cm) |
| 46 in (116.8 cm) | 39.1 in (99.3 cm) | 41.4 in (105.2 cm) |
| 48 in (121.9 cm) | 40.8 in (103.6 cm) | 43.2 in (109.7 cm) |
| 50 in (127 cm) | 42.5 in (108 cm) | 45 in (114.3 cm) |
For hips of a given size, a waist at or over the figure shown puts the ratio at or over the cut-off.
What the ratio cannot show
The cut-off marks a level of risk seen across groups of people. It is a screening line and it does not test for any disease. For your own health, the person to ask is a doctor or nurse.
A ratio hides size. A 74 cm waist with 99 cm hips gives 0.75, and so does a 97.5 cm waist with 130 cm hips. The waist to height ratio calculator sets the waist against height instead. How the two measures differ is the subject of waist to hip ratio vs waist to height ratio.
The cut-offs rest mostly on European data. The WHO report says that most indicators of abdominal obesity were derived from predominantly European populations. For Asian populations it gives 0.90 for men and 0.80 for women as example values from studies, without adopting them.
Waist and hips both change with weight, and not equally. In a long-running US study cited by WHO, a gain of 4.5 kg added about 4 cm to men's waists and 2.5 cm to their hips. For women the figures were 3.3 cm and 3.6 cm, so the same gain moved the ratio more in men.
NICE, which writes health guidelines in England, looked at the same family of measures. Its committee found that BMI, waist circumference, waist to hip ratio and waist to height ratio could all predict weight-related conditions. For adults with a BMI under 35 it recommends the waist to height ratio alongside BMI.