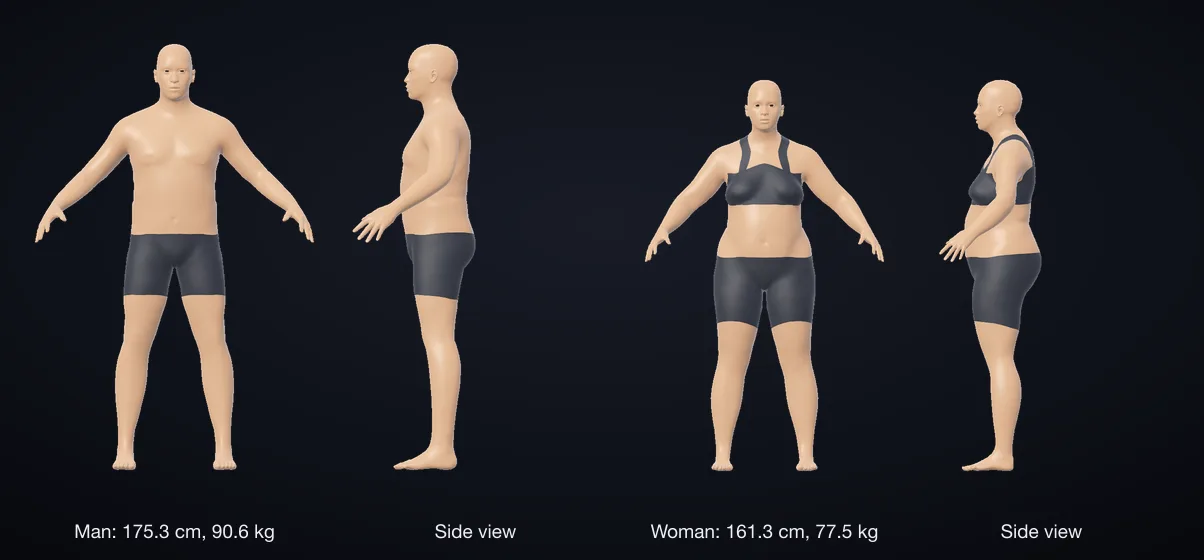
The average US man aged 20 or over is 175.1 cm tall (5 ft 9 in), weighs 90.3 kg (199.0 lb) and has a waist of 103.0 cm (40.6 in). The average US woman is 161.2 cm tall (5 ft 3.5 in), weighs 77.9 kg (171.8 lb) and has a waist of 97.9 cm (38.5 in). The mean BMI is 29.4 for men and 30.0 for women. These are CDC measurements of about 2,700 men and 3,300 women taken from August 2021 to August 2023.
The CDC's survey before that, from 2015 to 2018, measured about 5,100 men and 5,500 women. Each mean moved by less than 1 percent between the two. Its percentile tables are the ones used in the next two sections.
Height, weight, BMI and waist of US men, 2015 to 2018
The 2015 to 2018 means for men were 175.3 cm, 90.6 kg, a BMI of 29.4 and a waist of 102.9 cm. A percentile is the share of people at or under a value. A man of 180.2 cm is at the 75th percentile for height, so 75 in 100 US men are that tall or shorter.
| Measure | 5th | 25th | 50th | 75th | 95th |
|---|---|---|---|---|---|
| Height, cm | 162.8 | 170.1 | 175.4 | 180.2 | 187.4 |
| Height, in | 64.1 | 67.0 | 69.1 | 71.0 | 73.8 |
| Weight, kg | 61.7 | 75.3 | 87.4 | 101.9 | 130.3 |
| Weight, lb | 136.0 | 166.1 | 192.6 | 224.6 | 287.2 |
| BMI | 20.8 | 25.0 | 28.5 | 32.8 | 41.0 |
| Waist, cm | 77.6 | 91.7 | 101.8 | 112.1 | 132.6 |
| Waist, in | 30.6 | 36.1 | 40.1 | 44.1 | 52.2 |
The mean weight of 90.6 kg is 3.2 kg more than the median of 87.4 kg. Heavy weights stretch the top of the range: the 95th percentile is 42.9 kg over the median, and the 5th percentile is 25.7 kg under it.
Height, weight, BMI and waist of US women, 2015 to 2018
The 2015 to 2018 means for women were 161.3 cm, 77.5 kg, a BMI of 29.8 and a waist of 98.4 cm.
| Measure | 5th | 25th | 50th | 75th | 95th |
|---|---|---|---|---|---|
| Height, cm | 149.8 | 156.4 | 161.3 | 166.0 | 172.5 |
| Height, in | 59.0 | 61.6 | 63.5 | 65.3 | 67.9 |
| Weight, kg | 49.8 | 62.2 | 73.1 | 88.6 | 119.6 |
| Weight, lb | 109.7 | 137.1 | 161.2 | 195.3 | 263.8 |
| BMI | 19.7 | 23.9 | 28.4 | 33.9 | 44.6 |
| Waist, cm | 73.3 | 85.3 | 96.4 | 109.2 | 129.7 |
| Waist, in | 28.9 | 33.6 | 38.0 | 43.0 | 51.1 |
Women's weights are stretched the same way, with a 2015 to 2018 mean of 77.5 kg and a median of 73.1 kg. Height is not: the mean and the median are both 161.3 cm.
Three notes apply to both tables. The CDC tapes the waist at the top of the hip bone, so the waist rows are not trouser or dress sizes. The report prints waist in centimeters only, and the inch rows are those values divided by 2.54. The 2015 to 2018 mean BMIs of 29.4 and 29.8 fall in the CDC's overweight category, 25 to less than 30. In 2021 to 2023 the men's mean of 29.4 stayed there, while the women's mean of 30.0 reached obesity class 1, 30 to less than 35. The BMI visualizer places any height and weight in the same categories.
How the averages change with age
One figure for all adults hides an age pattern. In the 2015 to 2018 tables, men in their thirties and forties are the tallest group at 176.3 cm. Men aged 80 and over average 170.4 cm. Women average 162.6 cm in their twenties and 155.6 cm at 80 and over.
Waists run the other way. The mean rises from 94.2 cm for men aged 20 to 29 to 107.4 cm at ages 70 to 79. For women it rises from 92.1 cm at 20 to 29 to 101.7 cm at 60 to 69.
The 2021 to 2023 means, with hip girth
The CDC's 2025 report is its first since the 1988 to 1994 survey to include hip girth. It is also the source of the headline means.
| Measure | Men | Women |
|---|---|---|
| Height | 175.1 cm (68.9 in) | 161.2 cm (63.5 in) |
| Weight | 90.3 kg (199.0 lb) | 77.9 kg (171.8 lb) |
| BMI | 29.4 | 30.0 |
| Waist | 103.0 cm (40.6 in) | 97.9 cm (38.5 in) |
| Hips | 105.6 cm (41.6 in) | 109.8 cm (43.2 in) |
| Upper arm, relaxed | 34.7 cm (13.7 in) | 32.9 cm (13.0 in) |
Half of men have hips under 103.6 cm (40.8 in), and half of women under 106.8 cm (42.0 in). The range is wider for women: their 5th and 95th percentiles are 89.7 and 138.4 cm, against 89.5 and 129.1 cm for men.
Divide the mean waist by the mean height and the ratio is 0.59 for men and 0.61 for women. The NICE guideline in the UK asks adults to keep the waist under half their height. NICE measures midway between the ribs and the hip bone, a little higher than the CDC tape, so the match is rough. The waist to height ratio calculator works out the ratio for one person. A doctor or nurse can assess what the result means for that person's health.
Chest, neck, thigh and other girths from the US Army
The CDC survey does not tape the chest or neck, and it last taped the thigh and calf in 2005 to 2006. Its 2003 to 2006 report gives a mid-thigh mean of 53.8 cm (21.2 in) for men and 52.9 cm (20.8 in) for women. The calf means were 39.5 cm (15.6 in) and 38.3 cm (15.1 in).
For the other girths there is ANSUR II, a US Army survey that measured 4,082 men and 1,986 women between October 2010 and April 2012.
They are soldiers, not the general public, and the weights show it. The Army men average 85.5 kg and the Army women 67.8 kg, about 5 kg and 10 kg lighter than the CDC means. Heights are close, at 175.6 cm and 162.9 cm.
| Measure | Army men | Army women |
|---|---|---|
| Chest | 105.9 cm (41.7 in) | 94.7 cm (37.3 in) |
| Waist at the navel | 94.1 cm (37.0 in) | 86.1 cm (33.9 in) |
| Hips | 102.0 cm (40.1 in) | 102.1 cm (40.2 in) |
| Neck | 39.8 cm (15.7 in) | 33.0 cm (13.0 in) |
| Shoulders, girth | 117.9 cm (46.4 in) | 102.8 cm (40.5 in) |
| Shoulders, bone to bone | 41.6 cm (16.4 in) | 36.5 cm (14.4 in) |
| Upper arm, flexed | 35.8 cm (14.1 in) | 30.6 cm (12.0 in) |
| Thigh | 62.5 cm (24.6 in) | 61.6 cm (24.3 in) |
| Calf | 39.2 cm (15.4 in) | 37.3 cm (14.7 in) |
| Crotch height | 84.6 cm (33.3 in) | 78.2 cm (30.8 in) |
The Army's sites differ from the CDC's. Its waist is taped at the navel and its upper arm with the biceps flexed, so neither row matches a CDC figure. Its thigh is taped where the leg meets the buttock, higher than the CDC's mid-thigh site, and reads about 9 cm more. Crotch height runs from the floor to the crotch, the span the clothing standard ISO 3635 calls inside leg length. Each tape position is set out in how to take body measurements.
The average figures as a 3D model
The picture shows a man and a woman at the 2015 to 2018 mean height and weight. The model was given only those two numbers. Its male figure measures 99.2 cm at the waist and 107.7 cm at the hips, and its female figure 96.7 cm and 112.6 cm. The CDC waist means for 2015 to 2018 are 102.9 and 98.4 cm. Its 2021 to 2023 hip means are 105.6 and 109.8 cm.
A model at the mean height and weight is one figure, not a typical person. The percentile tables show how far real waists and hips spread around the mean. Enter your own numbers in the 3D body visualizer to see a figure built from them.