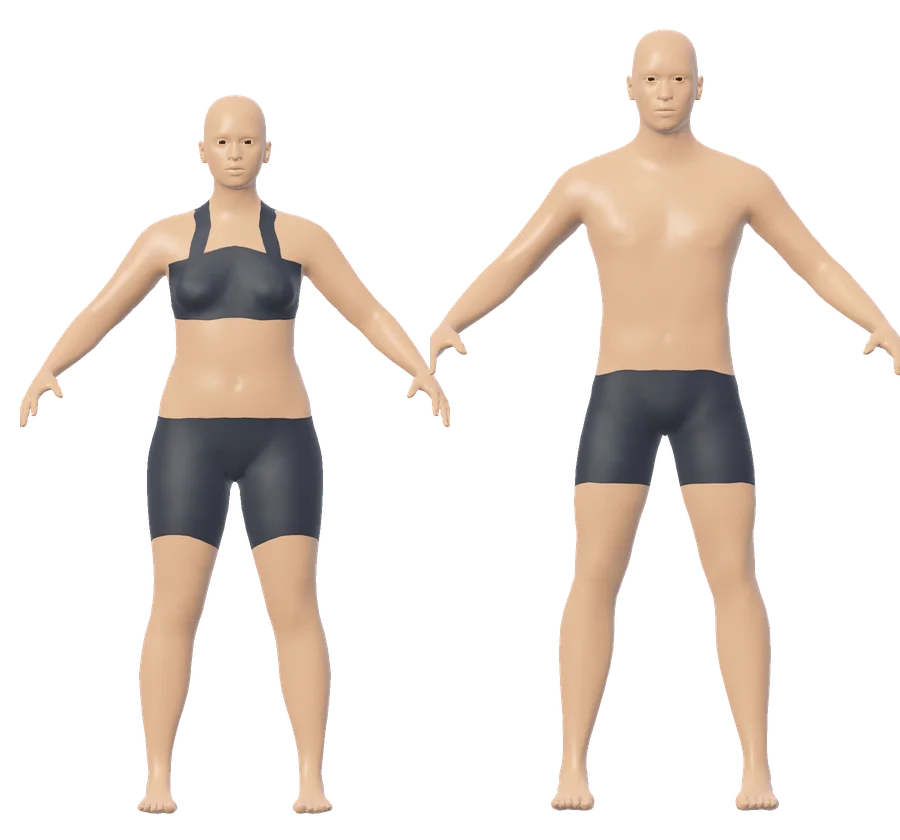
The average US man is 13.9 cm (5.5 inches) taller than the average US woman. In the CDC's measurements from August 2021 to August 2023, men averaged 175.1 cm and women 161.2 cm. The height comparison opens with those two figures side by side on one floor. Change either height or add more people, up to eight, and every difference is worked out again in centimeters, inches and percent.
The average US woman and man, sum by sum
The gap is a plain subtraction: 175.1 minus 161.2 is 13.9 cm. Dividing 13.9 by 2.54 turns it into 5.5 inches. Dividing her height by his gives 0.921, so the top of her head reaches 92.1 percent of his height.
The tool says it this way: "Average US man is the tallest at 5 ft 9 in (175.1 cm) and Average US woman the shortest at 5 ft 3.5 in (161.2 cm). The gap is 13.9 cm, or 5.5 inches."
The table sets everyone against the first person in the list. With the woman first, the man's row reads 13.9 cm (5.5 in) taller and 108.6 percent, because 175.1 divided by 161.2 is 1.086.
Add a third figure, the average Dutch man of 18 at 182.5 cm. His row reads 21.3 cm (8.4 in) taller and 113.2 percent: 182.5 minus 161.2 is 21.3, and 182.5 divided by 161.2 is 1.132. He is now named as the tallest, and the gap from tallest to shortest becomes 21.3 cm.
How each figure is sized and each difference counted
Each person is an adult body model scaled to the height entered. You choose a female or male figure and a build of slim, medium or heavier. The build sets the figure's weight from a BMI of 20, 23.5 or 28. At 175.1 cm that is 61.3 kg, 72.1 kg or 85.8 kg, since weight is BMI multiplied by the square of the height in meters. Build changes how wide the figure is drawn and never how tall.
All the figures stand on one floor, and each has a line at head height. The label under a figure gives the name and the height in the units chosen. The line at the head carries the same height in the other units.
Differences are counted from the heights as typed, at 2.54 cm to the inch. Heights in feet and inches are shown to the nearest half inch, which is why 161.2 cm reads 5 ft 3.5 in.
The average heights that can be added with one press come from two sources. The US woman and man are the CDC's means for adults aged 20 and older, measured from August 2021 to August 2023. The country averages are the NCD Risk Factor Collaboration's estimates for 18 year olds born in 1996.
Average heights to set beside your own
The CDC measured the standing height of 2,690 men and 3,307 women aged 20 and older with a wall-mounted stadiometer. A percentile is the height that the stated share of the group is at or under. A man of 184.8 cm (72.7 in) is as tall as or taller than 90 percent of US men. A woman of 170.4 cm (67.1 in) holds the same place among US women.
| Percentile | Men | Women |
|---|---|---|
| 5th | 162.2 cm (63.9 in) | 149.6 cm (58.9 in) |
| 10th | 165.2 cm (65.0 in) | 152.0 cm (59.8 in) |
| 25th | 170.0 cm (66.9 in) | 156.4 cm (61.6 in) |
| 50th | 175.2 cm (69.0 in) | 161.2 cm (63.5 in) |
| 75th | 180.1 cm (70.9 in) | 166.1 cm (65.4 in) |
| 90th | 184.8 cm (72.7 in) | 170.4 cm (67.1 in) |
| 95th | 187.2 cm (73.7 in) | 172.5 cm (67.9 in) |
| Mean | 175.1 cm (68.9 in) | 161.2 cm (63.5 in) |
For other countries, the NCD Risk Factor Collaboration pooled 1,472 measurement studies to estimate mean height by year of birth in 200 countries. Its data file gives the mean height at age 18, and the latest group in it was born in 1996.
| Country | Men | Women |
|---|---|---|
| Netherlands | 182.5 cm (6 ft 0 in) | 168.7 cm (5 ft 6.5 in) |
| Germany | 179.9 cm (5 ft 11 in) | 165.9 cm (5 ft 5.5 in) |
| France | 179.7 cm (5 ft 10.5 in) | 164.9 cm (5 ft 5 in) |
| Australia | 179.2 cm (5 ft 10.5 in) | 165.9 cm (5 ft 5.5 in) |
| Canada | 178.1 cm (5 ft 10 in) | 163.9 cm (5 ft 4.5 in) |
| Italy | 177.8 cm (5 ft 10 in) | 164.6 cm (5 ft 5 in) |
| United Kingdom | 177.5 cm (5 ft 10 in) | 164.4 cm (5 ft 4.5 in) |
| United States | 177.1 cm (5 ft 9.5 in) | 163.5 cm (5 ft 4.5 in) |
| South Korea | 174.9 cm (5 ft 9 in) | 162.3 cm (5 ft 4 in) |
| Turkey | 174.2 cm (5 ft 8.5 in) | 160.5 cm (5 ft 3 in) |
| Brazil | 173.6 cm (5 ft 8.5 in) | 160.9 cm (5 ft 3.5 in) |
| China | 171.8 cm (5 ft 7.5 in) | 159.7 cm (5 ft 3 in) |
| Japan | 170.8 cm (5 ft 7 in) | 158.3 cm (5 ft 2.5 in) |
| Mexico | 169.0 cm (5 ft 6.5 in) | 156.8 cm (5 ft 1.5 in) |
| Egypt | 166.7 cm (5 ft 5.5 in) | 157.3 cm (5 ft 2 in) |
| Nigeria | 165.9 cm (5 ft 5.5 in) | 156.3 cm (5 ft 1.5 in) |
| India | 164.9 cm (5 ft 5 in) | 152.6 cm (5 ft 0 in) |
| Bangladesh | 163.8 cm (5 ft 4.5 in) | 150.8 cm (4 ft 11.5 in) |
| Indonesia | 163.6 cm (5 ft 4.5 in) | 152.8 cm (5 ft 0 in) |
Across all 200 countries in that file, the tallest men born in 1996 are Dutch at 182.5 cm. The shortest are from Timor-Leste at 159.8 cm, a gap of 22.7 cm. Among women, Latvia is tallest at 169.8 cm and Guatemala shortest at 149.4 cm, a gap of 20.4 cm.
The two sets of US numbers differ because the groups differ. The CDC mean covers every adult aged 20 and older, measured in person. The NCD Risk Factor Collaboration number is an estimate for one group of 18 year olds. Older adults are shorter in the CDC data: men aged 80 and older averaged 170.5 cm, against 176.3 cm for men in their twenties. Average weight, waist and hip measurements of US adults are in the guide to average body measurements of US men and women.
What a lineup of figures leaves out
The figures are adult body models scaled to each height. They illustrate the heights and are not a likeness of anyone. A child's height gives a small adult figure, because the model has no child proportions. The three builds are presets and say nothing about a real person's weight.
One lineup holds up to eight people, each from 120 to 230 cm tall (3 ft 11 in to about 7 ft 6.5 in). The tallest man Guinness World Records lists, Robert Wadlow at 2.72 m (8 ft 11.1 in), is past that range.
A comparison is only as good as the heights typed in. Shoes, hair and posture all change a reading, and so does the time of day. In a study of eight young adults, height varied by 19.3 mm on average over 24 hours. A gap of a centimeter or two between two people can come from when and how each was measured.
The country averages are estimates with a margin. The data file gives Dutch men a 95 percent range of 180.6 to 184.5 cm around the 182.5 cm mean. An average describes a group and says nothing about whether one person's height is healthy.
Adding people, switching units and sharing a lineup
Press "Add a person" for each new figure, up to eight. A name is optional, and unnamed figures are labeled Person 1, Person 2 and so on. Each person has a female or male figure, a height and a build, and can be removed again.
Heights can be typed in feet and inches or in centimeters. Whichever you use, the results give both.
Turn the lineup by dragging it, swiping it or pressing the arrow keys. To zoom, pinch on a touch screen, hold Ctrl and roll the mouse wheel, or use the plus and minus buttons. Holding Shift while dragging slides the lineup across the view. Front, Side and Back are one press each.
A PNG of the lineup downloads with "Save image". The "Copy a link to this lineup" button makes a link that holds the names, heights and builds inside the link itself. Anyone who opens it sees those names. Nothing typed is sent to a server, and the differences are worked out in your browser.
To give a single figure its own weight and tape measurements, use the 3D body visualizer.