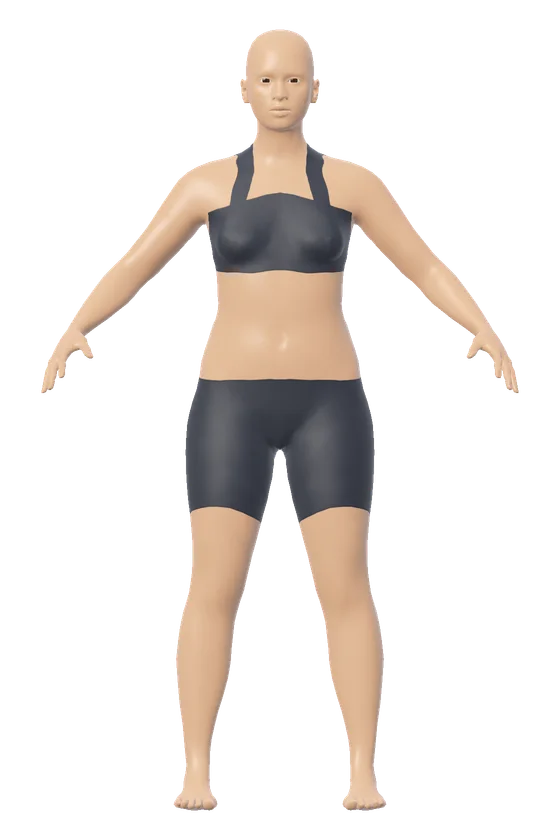
The BMI visualizer draws five figures at the height you enter, at BMI 17, 21.7, 27.5, 32.5 and 40. The figure in your own band is redrawn at your exact weight and marked "You". Beside the row are your BMI, its CDC category and the weight range of every category at your height.
200 lb at 5 ft 9 in, step by step
The CDC's measurements from August 2021 to August 2023 put the average US man at 68.9 inches, just under 5 ft 9 in, and 199 lb. Take 5 ft 9 in and 200 lb as round numbers. BMI is weight in kilograms divided by the square of height in meters, so the sum uses 90.7 kg and 1.753 m. The height squared is 3.072, and 90.7 divided by 3.072 is 29.5.
The tool puts the result in one sentence: "200 lb at 5 ft 9 in is a BMI of 29.5, which the CDC lists as overweight." At that height the healthy weight band runs from 125 lb to 169 lb. So 200 lb is 31 lb past its upper end, and obesity class 1 starts at 203 lb.
In the row, four reference figures are drawn at 115 lb (BMI 17), 147 lb (BMI 21.7), 220 lb (BMI 32.5) and 271 lb (BMI 40). The figure in the 25 to 29.9 slot is drawn at 200 lb and labeled "You, BMI 29.5". One inch less height moves the same 200 lb into the next category: at 5 ft 8 in the BMI is 30.4.
Why five figures stand for six bands
The CDC lists four categories for adults: underweight, healthy weight, overweight and obesity. Obesity has three classes, which makes six bands. The row has one figure for each of the first four bands, and obesity classes 2 and 3 share one figure at BMI 40.
| CDC category | BMI | Figure in the row |
|---|---|---|
| Underweight | Less than 18.5 | BMI 17 |
| Healthy weight | 18.5 to less than 25 | BMI 21.7 |
| Overweight | 25 to less than 30 | BMI 27.5 |
| Obesity class 1 | 30 to less than 35 | BMI 32.5 |
| Obesity class 2 | 35 to less than 40 | BMI 40, shared |
| Obesity class 3 | 40 or greater | BMI 40, shared |
Each reference figure is a general body model at your height. Its weight is the BMI multiplied by the square of the height in meters, and the model sizes the figure's volume to that weight. The 3D body visualizer uses the same model and adds tape measurements. The female or male switch changes which figure is drawn and nothing else.
The tool prints the healthy band as 18.5 to 24.9 and takes the weight at BMI 24.9 as its upper end. The category is read from the BMI as shown, to one decimal place, and follows the CDC's lines. A BMI from 18.5 to under 25 is healthy weight, exactly 25 is overweight and exactly 30 is obesity class 1.
Healthy weight band from 4 ft 10 in to 6 ft 4 in
Each band is the sum the tool runs for your own height. It multiplies 18.5 and 24.9 by the square of the height in meters.
| Height | Healthy weight band | In kilograms | BMI 30 starts at |
|---|---|---|---|
| 4 ft 10 in | 89 to 119 lb | 40.2 to 54 kg | 144 lb |
| 5 ft 0 in | 95 to 127 lb | 43 to 57.8 kg | 154 lb |
| 5 ft 2 in | 101 to 136 lb | 45.9 to 61.8 kg | 164 lb |
| 5 ft 4 in | 108 to 145 lb | 48.9 to 65.8 kg | 175 lb |
| 5 ft 6 in | 115 to 154 lb | 52 to 70 kg | 186 lb |
| 5 ft 8 in | 122 to 164 lb | 55.2 to 74.3 kg | 197 lb |
| 5 ft 10 in | 129 to 174 lb | 58.5 to 78.7 kg | 209 lb |
| 6 ft 0 in | 136 to 184 lb | 61.9 to 83.3 kg | 221 lb |
| 6 ft 2 in | 144 to 194 lb | 65.4 to 88 kg | 234 lb |
| 6 ft 4 in | 152 to 205 lb | 68.9 to 92.8 kg | 246 lb |
For scale, the same CDC survey put the mean BMI of US adults at 29.4 for men and 30.0 for women. Half of the men measured had a BMI of 28.2 or more, and half of the women 28.3 or more.
What BMI can and cannot say about a body
The CDC describes BMI as a screening measure that is not intended to diagnose disease or illness. It does not measure body fat directly. It does not distinguish between fat, muscle and bone mass, and it does not show where the body carries its fat.
So the five figures are drawn at a typical build. A person with a lot of muscle can share a BMI of 27.5 with the third figure and look quite different from it. For where the weight sits, NICE uses waist to height ratio as well as BMI in adults with a BMI under 35. The waist to height ratio calculator does that sum, and the body fat calculator estimates body fat from tape measurements.
Cut-offs also differ between health bodies. The World Health Organization draws the same two main lines as the CDC: 25 or more for overweight and 30 or more for obesity. In the UK, NICE uses lower thresholds for people with a South Asian, Chinese, other Asian, Middle Eastern, Black African or African-Caribbean background. For them overweight is 23 to 27.4 and obesity is 27.5 or more. A WHO expert consultation in 2004 kept 25 and 30 as the international classification. It added public health action points at 23, 27.5, 32.5 and 37.5. The BMI visualizer applies the CDC categories to every adult. The guide to BMI categories and limits goes through each cut-off and its source.
Those categories are for adults aged 20 and over. For ages 2 to 19 the CDC uses BMI percentiles for age and sex, which the BMI visualizer does not calculate.
The tool accepts heights from 120 to 230 cm and weights from 30 to 250 kg. The model's shape runs from about BMI 13 to about BMI 50. Past either end the "You" figure stops at its lightest or heaviest shape, while the BMI and category still come from the numbers entered.
A doctor or nurse can weigh BMI together with other measures when assessing your own health.
Switching units, turning the row and sharing a result
Height and weight can be typed in centimeters and kilograms, in feet, inches and pounds, or in feet, inches, stone and pounds. Switching keeps the values, so 200 lb reads 90.7 kg or 14 st 4 lb.
The row turns in any direction with a drag, a swipe or the arrow keys. It zooms with a pinch, with Ctrl and the mouse wheel, or with the plus and minus buttons. Front, Side and Back show the five figures from each direction, and the home button brings the front view back.
To share a result, press "Copy a link to this result". The link carries the height, weight and units inside itself. The numbers are worked out in your browser and are not sent to a server.