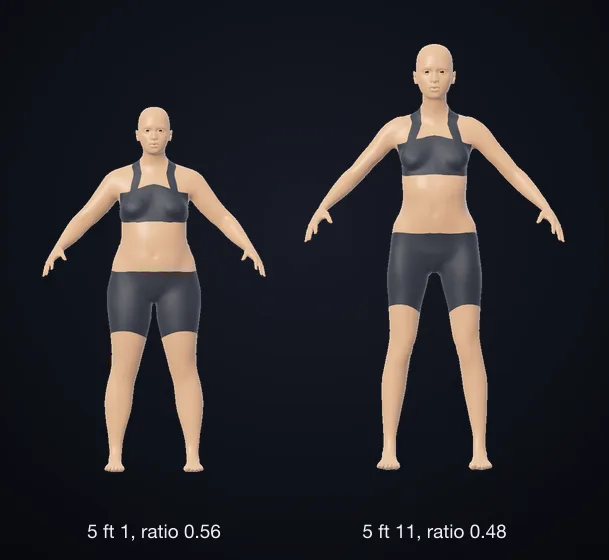
Waist to hip ratio is your waist divided by your hips. Waist to height ratio is the same waist divided by your height. A WHO table puts substantially increased risk at a waist to hip ratio of 0.90 or more for men and 0.85 or more for women. NICE, which produces guidance for the UK's National Health Service, starts its increased band for waist to height ratio at 0.5 for everyone. NICE's 2025 guideline uses waist to height ratio. The WHO's 2008 expert group had too little data on it to rank it.
What each ratio is
| Measure | How it is worked out | Cut-offs |
|---|---|---|
| Waist to hip ratio | Waist / hips | Separate for men and women |
| Waist to height ratio | Waist / height | One set for both sexes |
| Waist circumference | The tape reading alone | Separate for men and women |
Both ratios use the same waist reading and the same units top and bottom, so inches or centimeters give the same answer. Both are ways to estimate fat carried around the middle, which NICE calls central adiposity. Neither ratio uses weight.
How to measure waist and hips with the WHO protocol
The WHO's expert report recommends one protocol for both tape readings:
- Stand with your feet close together, arms at your sides and your weight spread evenly, wearing little clothing.
- For the waist, find the lowest rib you can feel and the top of the hip bone (the iliac crest). Put the tape midway between them.
- For the hips, put the tape around the widest part of the buttocks.
- Keep the tape level with the floor and snug, but not so tight that it constricts.
- Read the tape at the end of a normal breath out.
- Take each reading twice. If the two are within 1 cm, use the average. If not, measure again.
NICE gives the same waist site for measuring at home: midway between the bottom of the ribs and the top of the hips. It says that spot is a little higher than the belly button. The US National Heart, Lung, and Blood Institute (NHLBI) describes a lower site, with the tape resting just over the hipbones. The WHO report cites a review of 120 studies on this point. It found the choice of waist site made no substantial difference to the link between waist size and disease.
The cut-offs for each measure
| Measure and source | Men | Women | What it marks |
|---|---|---|---|
| Waist to hip ratio, WHO table | 0.90 or more | 0.85 or more | Substantially increased risk |
| Waist, WHO table | Over 94 cm | Over 80 cm | Increased risk |
| Waist, WHO table | Over 102 cm | Over 88 cm | Substantially increased risk |
| Waist, NHLBI | Over 40 in | Over 35 in | Higher risk of heart disease and type 2 diabetes |
| Waist to height ratio, NICE | 0.5 to 0.59 | 0.5 to 0.59 | Increased central adiposity |
| Waist to height ratio, NICE | 0.6 or more | 0.6 or more | High central adiposity |
The WHO rows describe the risk of metabolic complications. The report is careful about them. It calls them the values "often attributed to WHO". It says the waist figures were first printed as an example only. They came from a Dutch sample of 2,183 men and 2,698 women aged 20 to 59. It also says studies of Asian populations point to lower values. Its example for men and women is 85 cm and 80 cm for waist, and 0.90 and 0.80 for waist to hip ratio.
NICE classes a waist to height ratio of 0.4 to 0.49 as healthy central adiposity. Its bands apply to adults with a BMI under 35, of both sexes and all ethnicities, including adults with high muscle mass. The risks it names are type 2 diabetes, hypertension and cardiovascular disease.
Which ratio the evidence favors, and according to whom
The WHO consultation of 2008 found no consensus on which waist measure is tied most strongly to cardiovascular risk. It favored plain waist circumference over waist to hip ratio because it is easier to take. On waist to height ratio it said there was too little data to give it priority.
Four years later, Ashwell, Gunn and Gibson pooled 31 papers covering more than 300,000 adults. The papers compared how well each measure picks out adults with hypertension, type 2 diabetes and related conditions. Compared with BMI, waist circumference improved that by 3 percent and waist to height ratio by 4 to 5 percent. Waist to height ratio also did significantly better than waist circumference. The abstract reports no comparison with waist to hip ratio.
NICE looked at the same question for its guideline. Its committee found that BMI, waist circumference, waist to hip ratio and waist to height ratio could all predict weight-related conditions accurately. It recommended waist to height ratio, used with BMI, for adults with a BMI under 35. The committee's stated reasons are that one classification fits all ethnicities and both sexes, and that it still works for adults with high muscle mass. The cut-off in the studies sat around 0.5. That gives a message that is easy to remember: keep your waist to less than half your height.
One direct comparison comes from a 2025 study of 10,690 adults by Martone and colleagues. Waist to height ratio identified poorer results on a chair stand test better than waist to hip ratio did. That outcome is a test of physical performance, not heart disease or diabetes.
None of these sources shows waist to hip ratio failing. The case NICE makes for waist to height ratio is one set of bands for everyone and a message that is easy to pass on.
A worked example: one waist at two heights
Take a woman with a 34 in (86.4 cm) waist and 41 in (104.1 cm) hips. Her waist to hip ratio is 34 divided by 41, which is 0.83. That is under the 0.85 line in the WHO table. Her waist is over the table's 80 cm line and under its 88 cm line.
Her waist to height ratio depends on how tall she is. At 5 ft 1 (61 in) it is 34 divided by 61, which is 0.56, in NICE's increased band. At 5 ft 11 (71 in) it is 34 divided by 71, which is 0.48, in the healthy band. The tape readings are identical. Only the height differs.
For a man with a 38 in (96.5 cm) waist and 40 in hips at 5 ft 10 (70 in), the two ratios agree. Waist to hip ratio is 0.95, past the 0.90 line. Waist to height ratio is 0.54, in the increased band. His waist is over 94 cm and under 102 cm.
You can run your own tape readings through the waist to hip ratio calculator and the waist to height ratio calculator. These cut-offs describe risk seen across large groups of people. Your own health is for a doctor or nurse to assess.