Adult body mass index (BMI) is sorted at five cut-offs: 18.5, 25, 30, 35 and 40. Less than 18.5 is underweight and 18.5 to less than 25 is healthy weight. From 25 to less than 30 is overweight. A BMI of 30 or more is obesity, which has three classes. The CDC and the World Health Organization (WHO) use the same numbers. The CDC calls BMI a screening measure, and a WHO report calls it a crude one. It cannot tell fat from muscle or show where fat sits.
The adult BMI categories and cut-offs
| CDC category | CDC range | WHO report name and range |
|---|---|---|
| Underweight | Less than 18.5 | Underweight, less than 18.50 |
| Healthy weight | 18.5 to less than 25 | Normal range, 18.50 to 24.99 |
| Overweight | 25 to less than 30 | Preobese, 25.00 to 29.99 |
| Class 1 obesity | 30 to less than 35 | Obese class I, 30.00 to 34.99 |
| Class 2 obesity | 35 to less than 40 | Obese class II, 35.00 to 39.99 |
| Class 3 obesity | 40 or greater | Obese class III, 40.00 or more |
The CDC applies its table to adults aged 20 and older, regardless of age, sex or race. The WHO table comes from its 2000 report on obesity. That report says the values are the same for both sexes and do not depend on age. In the WHO table the word overweight covers every BMI of 25.00 or more, so its 25 to 29.99 band has its own name, preobese.
A BMI of exactly 25.0 is overweight on both tables, and exactly 30.0 is obesity. The WHO's current fact sheet states the two main lines the same way. Overweight is a BMI of 25 or more and obesity is 30 or more.
The line at 35 was added by that WHO report. It gives the reason: the options for managing obesity differ once BMI passes 35. NICE, which produces guidance for the UK's National Health Service, prints the same classes as 30 to 34.9, 35 to 39.9 and 40 or more.
How BMI is calculated in kilograms and in pounds
| Units | Formula | Example |
|---|---|---|
| Kilograms and meters | weight / height squared | 70 kg at 1.75 m: 22.9 |
| Kilograms and centimeters | weight / height / height x 10,000 | 70 kg at 175 cm: 22.9 |
| Pounds and inches | weight / height squared x 703 | 160 lb at 65 in: 26.6 |
The metric example is the WHO report's own: an adult of 70 kg and 1.75 m has a BMI of 22.9. The working is 1.75 times 1.75, which is 3.0625, and then 70 divided by 3.0625. The other two formulas are the CDC's.
In pounds and inches, 160 lb at 5 ft 5 works out like this. Sixty-five inches squared is 4,225. Then 160 divided by 4,225, times 703, is 26.6.
The 703 is a unit conversion and nothing more. NIST lists one pound as 0.4536 kg and one inch as 0.0254 m, and 0.4536 divided by 0.0254 squared is 703.1. The BMI visualizer does the arithmetic in centimeters and kilograms or in feet and pounds.
What BMI does not measure, in the CDC's and the WHO's words
The CDC says "BMI does not distinguish between fat, muscle, and bone mass." It adds that BMI does not indicate what types of fat people have, or where in the body they carry it. Its calculator states that BMI "is not intended to diagnose disease or illness."
The WHO report makes the same point: "BMI does not distinguish between weight associated with muscle and weight associated with fat." It also records that the share of body fat rises with age up to 60 to 65 years. At the same BMI it is higher in women than in men. A third limit in the report is fat distribution: BMI does not account for how fat is spread over the body.
NICE tells clinicians to interpret BMI with caution in adults with high muscle mass and in people aged 65 and over. For adults with a BMI under 35 it tells them to use waist to height ratio as well as BMI. The waist to height ratio calculator works that out from a waist and a height. The CDC notes that a DEXA scan measures body composition precisely but is expensive and not widely available. The body fat calculator gives an estimate from tape measurements instead.
Why two people with the same BMI can look different
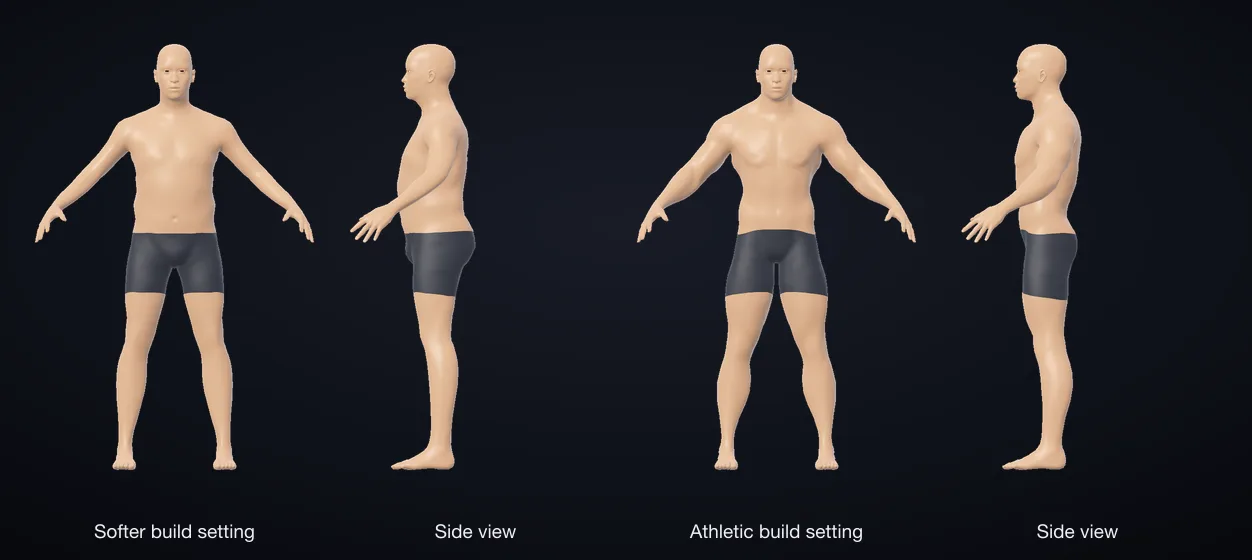
BMI uses height and weight and nothing else, so every body of one height and weight gets one number. The two male figures are both 5 ft 10 and 190 lb (86.2 kg), a BMI of 27.3. The two female figures are both 5 ft 5 and 160 lb (72.6 kg), a BMI of 26.6. Inside each pair, only the build setting differs.
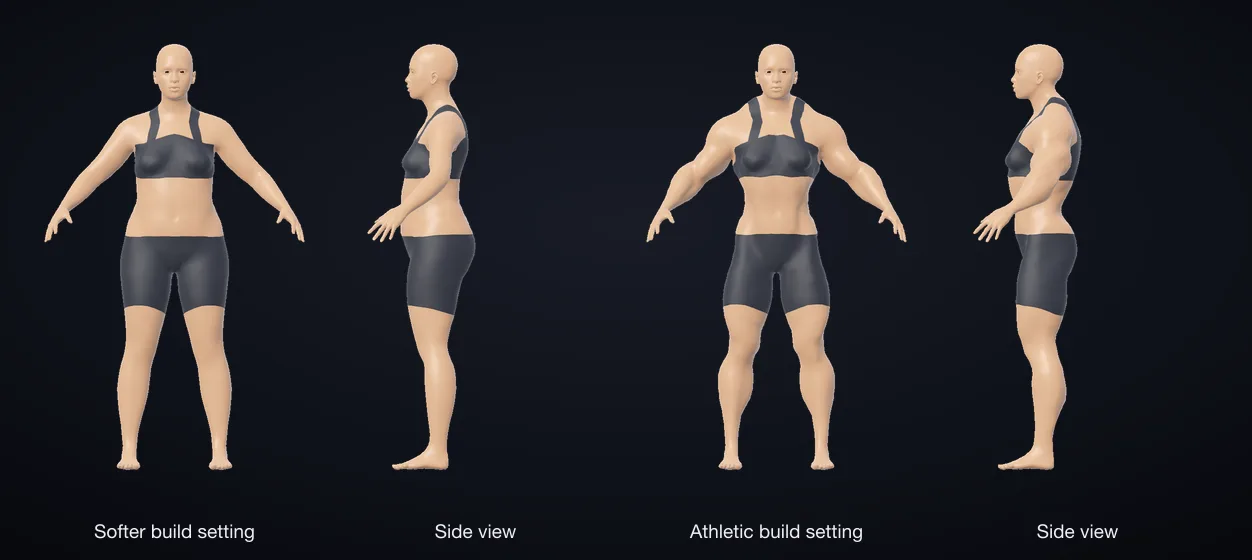
With the softer setting the male figure has a 98.0 cm waist and a 103.3 cm chest. With the athletic setting the waist is 80.9 cm and the chest 105.1 cm. On the female figures the waist is 87.9 cm with the softer setting and 70.6 cm with the athletic one.
The build setting belongs to the model. It moves the same weight toward muscle or toward fat so the difference can be seen. It is not a measurement of anyone's muscle or fat. Real bodies of one height and weight differ in more ways than one setting can show. You can try the setting on your own height and weight in the 3D body visualizer.
The lower action points for Asian populations
In 2004 a WHO expert consultation asked whether Asian populations need their own cut-offs. It concluded that a substantial share of Asian people are at high risk of type 2 diabetes and cardiovascular disease at BMIs lower than 25. The BMI at which risk was observed ran from 22 to 25 in different Asian populations, and for high risk from 26 to 31.
The consultation did not redefine the cut-offs for each population. It kept 25 and 30 as the international classification and added four public health action points at 23.0, 27.5, 32.5 and 37.5. Countries can use them to decide where increased risk starts for their own people.
NICE's 2025 guideline goes a step further. It sets lower thresholds for people with a South Asian, Chinese, other Asian, Middle Eastern, Black African or African-Caribbean background. For them overweight is a BMI of 23 to 27.4 and obesity is 27.5 or more. For those groups, obesity classes 2 and 3 are usually found by lowering the usual lines by 2.5, to about 32.5 and 37.5.
| Body and year | Lines it draws | Who they apply to |
|---|---|---|
| CDC | Overweight 25, obesity 30 | Adults 20 and older, any sex or race |
| WHO report, 2000 | Overweight 25, obesity 30 | Adults, both sexes |
| WHO expert consultation, 2004 | Action points at 23.0, 27.5, 32.5, 37.5 | Asian populations, with 25 and 30 kept |
| NICE NG246, 2025 | Overweight 23, obesity 27.5 | Six named family backgrounds |
The difference matters near the lines. A BMI of 24.1, which is 145 lb at 5 ft 5, is healthy weight on the CDC's table and overweight on NICE's lower thresholds. Which table fits you, and what your own number means for your health, is a question for a doctor or nurse.